“It is a capital mistake to theorize before one has data.”
– Arthur Conan Doyle.
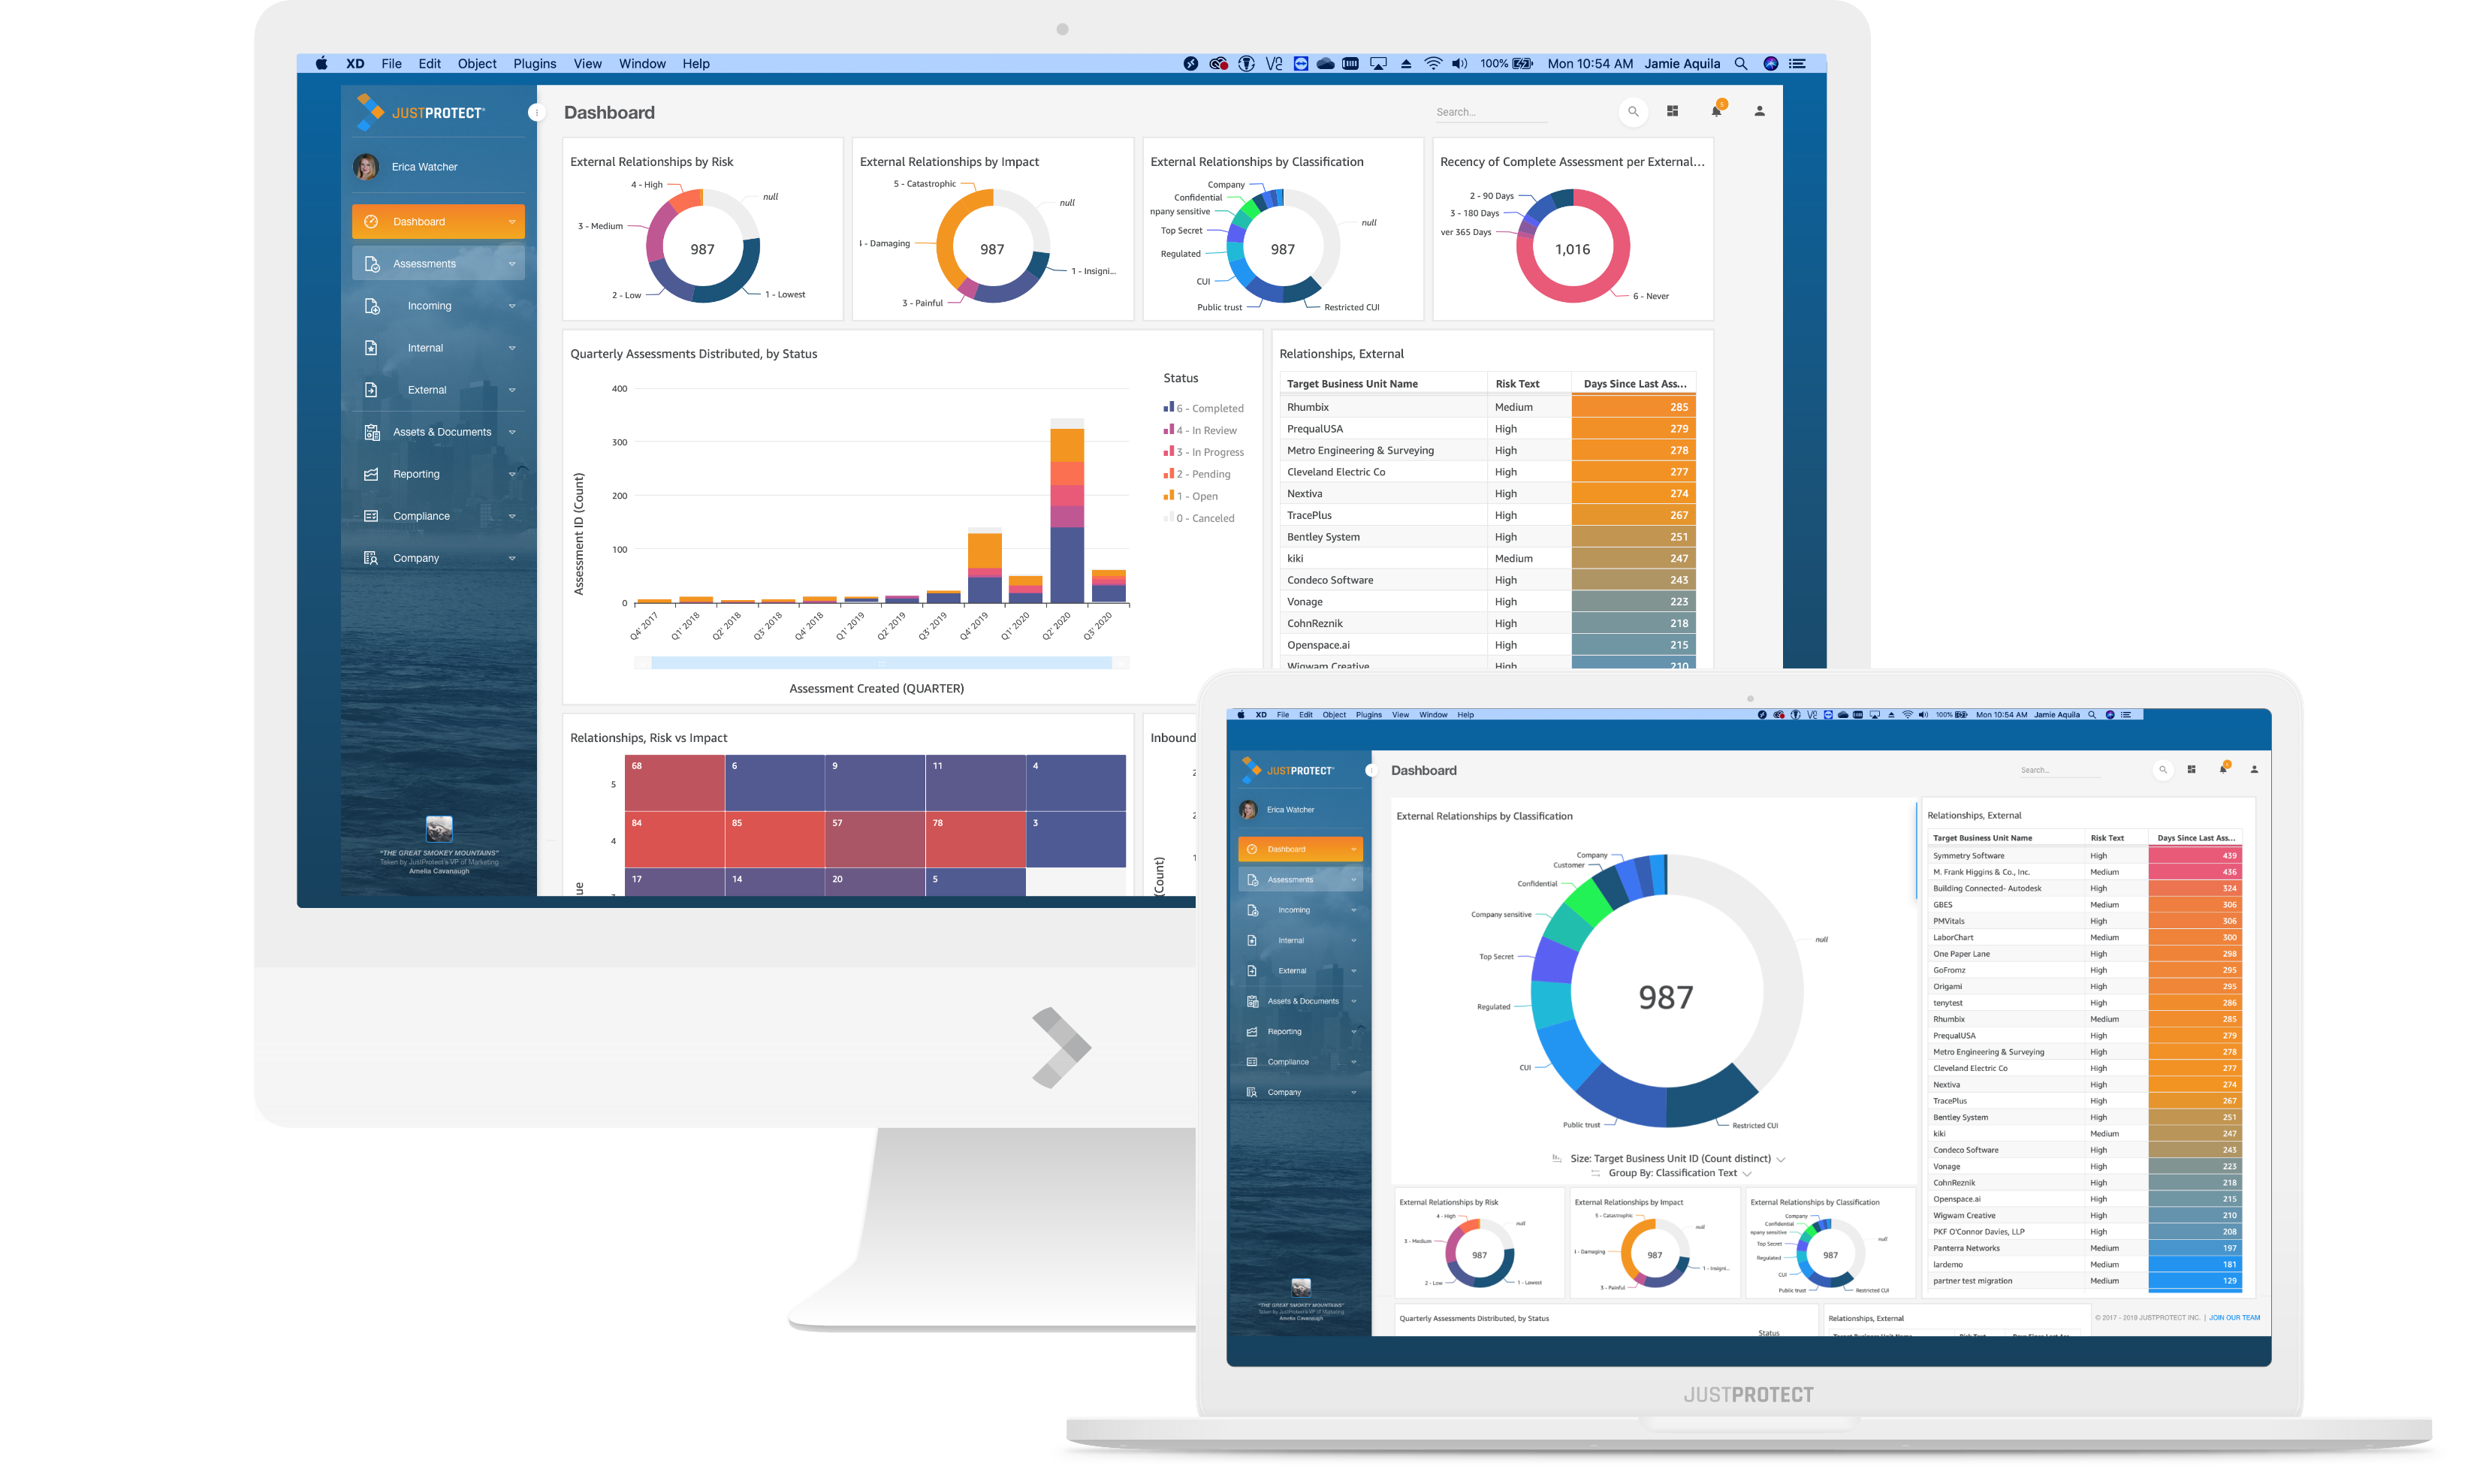
Launching with Version 3.3, you'll now have the ability to create dashboards to visualize and explore live or historical data in your JustProtect account.
Quickly identify trends and exceptions, drill-down into datasets for more detail, and launch views or operations directly from your dashboards. JustProtect dashboards provide operational intelligence to help you manage your assessments in real-time. You can use filters to refine the data displayed in a visual.
Filters are applied to the data before any aggregate functions that you specify.
A filter is associated with a single dataset in an analysis. It can be scoped to one, several, or all visuals in the analysis that use that dataset. By default, a filter applies only to the visual that was selected when the filter was created. You can change the scope of a filter after you create it.
Each filter applies only to a single field. You can apply filters to both regular and calculated fields.
If you create multiple filters, all top-level filters apply together using AND. If you group filters by adding them inside a top-level filter, the filters in the group apply using
OR.
JustProtect applies all of the enabled filters to the field. For example, suppose that there is one filter of state = WA and another filter of sales >= 500. In this case, the dataset only contains records that meet both of those criteria. If you disable one of these, only one filter applies.
Take care that multiple filters applied to the same field aren't mutually exclusive.
Halfboards
Halfboards are mini-dashboards. JustProtect has added Halfboards through the system to provide insights on items such as Business Unit Relationships, Assets, Risks, Tasks, and, of course, Assessments.
 For Enterprise
For our Enterprise customers, these dashboards are completely customizable. The JustProtect Client Success Team can work with you to set up your Dashboard as you see fit.
Dashboards are also mailable, and you can have your Dashboard emailed to you or your key stakeholders on a recurring basis.
Take it for a test drive
Take your data for a spin. Your Dashboard is now accessible on your JustProtect account. Don’t have an account yet? Click here to set up some time.